
Updated October 3, 2026
ROAS and profitability with Spybox
Is a ROAS of 3 enough for your store? Calculate what each order can fund before choosing an advertising budget or a new creative.
Contents
ROAS measures revenue, not profit
ROAS = value attributed to ads ÷ media spend
ROAS, or Return On Ad Spend, divides the value attributed to ads by their media spend. With €1,500 in value and €500 in media spend, it is 3: each advertising euro corresponds to €3 of attributed value. As a percentage, the same ratio is 300%. That figure does not yet account for the cost of the product sold.
In this guide, the ROAS denominator is media spend. Content, tools and agency expenses are included separately in the review. If another ratio puts those costs in the denominator, name its scope: otherwise two figures called ROAS may measure different things. Start with your account and orders, not a competitor's ad score.
How much can you pay to acquire an order?
The prefilled example uses €50 in net revenue, €30 in variable costs and €5 to retain after ads. Entered amounts stay on this page: the calculator does not send them or connect an advertising account. Its result is a simplified economic ratio, not an automatic bidding recommendation.
Use a consistent tax-exclusive basis and the same set of orders. Net revenue allows for discounts and refunds; costs also include what remains payable on returned orders. If incident costs are already included in your average cost, do not deduct them again.
- Available before ads
- €20.00
- Simplified break-even ROAS
- 2.50
- Maximum acquisition cost
- €15.00
- ROAS to retain your chosen amount
- 3.34
Revenue ÷ (revenue − variable costs − amount to retain).
ROAS thresholds are rounded up to two decimal places. The result does not set account bids or automatically cover costs you have not entered.
There is no universally good ROAS
A €50 order with €30 in variable costs leaves €20 before advertising and overheads. Paying €20 to acquire it uses the entire contribution. The simplified threshold is therefore 50 ÷ 20 = 2.5. It covers variable costs and media spend, but not rent, working time or ad production.
If you want to retain €5 per order for other expenses and your result, allowable acquisition cost falls to €15. The required ratio becomes 50 ÷ 15, about 3.33. The calculator rounds this up to 3.34. Choose that reserve from your own operating figures; €5 is not a rule for stores.
The shortened break-even formula is 1 ÷ contribution rate before advertising, provided revenue and costs have a consistent basis. Calculate that rate against the selling price, not purchase cost. A margin expressed relative to supplier cost is therefore not interchangeable with the percentages in the table.
| Contribution before ads | Simplified threshold | What that ratio covers |
|---|---|---|
| 75% of revenue | 1 ÷ 0.75 ≈ 1.33 | Variable costs and media only; retaining more requires a higher ratio. |
| 50% of revenue | 1 ÷ 0.50 = 2 | Same assumption, without adding overheads or production. |
| 40% of revenue | 1 ÷ 0.40 = 2.5 | The €50 order with €30 in variable costs. |
| 25% of revenue | 1 ÷ 0.25 = 4 | A smaller contribution leaves less money to acquire an order. |
75% of revenue
- Simplified threshold
- 1 ÷ 0.75 ≈ 1.33
- What that ratio covers
- Variable costs and media only; retaining more requires a higher ratio.
50% of revenue
- Simplified threshold
- 1 ÷ 0.50 = 2
- What that ratio covers
- Same assumption, without adding overheads or production.
40% of revenue
- Simplified threshold
- 1 ÷ 0.40 = 2.5
- What that ratio covers
- The €50 order with €30 in variable costs.
25% of revenue
- Simplified threshold
- 1 ÷ 0.25 = 4
- What that ratio covers
- A smaller contribution leaves less money to acquire an order.
This table does not set expected performance for Meta, TikTok or Google. It explains the relationship between revenue, costs and media. Overheads, cash needs, new creative production and the share of orders ultimately retained may increase your actual requirement.
Repeat purchases can change a customer acquisition calculation. Assess them separately, over an explicit period, with the costs of subsequent orders. An intention to buy again or an industry average cannot replace observed receipts. First-purchase ROAS does not improve simply because a customer might return.
Two offers: higher ROAS can leave less money
Fictional exercise, not a customer result: a store sells a set of vacuum storage bags. We compare two offers after the return observation period, on one channel, with unique orders. All amounts exclude tax; revenue has already been reconciled with payments and refunds. Average variable costs of €30 include product, fulfilment, shipping, payment and incident costs within this scope.
Offer A sells for €50. Offer B applies a €5 discount without reducing variable cost. B records more orders and slightly higher ROAS. Now examine contribution after media: the conclusion changes. These two sets of figures illustrate arithmetic; they are not a test establishing the causal effect of the discount.
| Item | A: €50 offer | B: discounted to €45 |
|---|---|---|
| Net revenue per order | €50 | €45 |
| Retained orders | 100 | 120 |
| Net revenue | 100 × €50 = €5,000 | 120 × €45 = €5,400 |
| Media spend | €1,800 | €1,900 |
| Variable costs | 100 × €30 = €3,000 | 120 × €30 = €3,600 |
| ROAS on reconciled revenue | 5,000 ÷ 1,800 ≈ 2.78 | 5,400 ÷ 1,900 ≈ 2.84 |
| Contribution after ads | 5,000 − 3,000 − 1,800 = €200 | 5,400 − 3,600 − 1,900 = −€100 |
Net revenue per order
- A: €50 offer
- €50
- B: discounted to €45
- €45
Retained orders
- A: €50 offer
- 100
- B: discounted to €45
- 120
Net revenue
- A: €50 offer
- 100 × €50 = €5,000
- B: discounted to €45
- 120 × €45 = €5,400
Media spend
- A: €50 offer
- €1,800
- B: discounted to €45
- €1,900
Variable costs
- A: €50 offer
- 100 × €30 = €3,000
- B: discounted to €45
- 120 × €30 = €3,600
ROAS on reconciled revenue
- A: €50 offer
- 5,000 ÷ 1,800 ≈ 2.78
- B: discounted to €45
- 5,400 ÷ 1,900 ≈ 2.84
Contribution after ads
- A: €50 offer
- 5,000 − 3,000 − 1,800 = €200
- B: discounted to €45
- 5,400 − 3,600 − 1,900 = −€100
A leaves €200 before overheads and content, while B loses €100 before those same expenses. B's simplified threshold is 45 ÷ (45 − 30) = 3. Its ROAS of 2.84 is below that. The discount improved the observed revenue/media ratio but reduced the amount available for advertising per order.
To retain €5 per order, A would allow €15 in acquisition cost and B €10. With €45 in revenue, the corresponding ratio would be 4.5. Before offering a discount, calculate its impact on contribution, handling expenses and required volume. An additional sale helps the result only when its revenue covers the expenses it creates.
The same reasoning applies to free shipping or bundles. Specify the contents, new revenue and added costs; do not assume a higher basket value automatically increases contribution. You can then look for a clearer advertising explanation instead of a further discount.
Reconcile platform reports with the store
An order may be assigned to an earlier interaction or reported by conversion date, depending on the report. Click, engaged-view and impression windows are not necessarily identical. Google Ads explains these tracking periods and conversion delays. Compare periods that have had time to receive expected purchases, keeping the same settings.
If Meta and Google each attribute value to the same order, adding them does not create a second sale. Reconcile store data and document discrepancies: refunds, currency, taxes, shipping charges, dates or duplicate events. Better tracking can increase reported ROAS without adding orders.
Total revenue divided by all advertising spend helps monitor the whole store. It also includes organic sales and returning customers. It does not establish the additional sales caused by one ad. Answering that question requires an appropriate comparison or experiment with sufficient volume.
| Metric | Question it answers | Not the same as |
|---|---|---|
| Platform ROAS | What value does this report attribute to this spend? | Profit, all store net orders or a demonstrated causal effect. |
| Cost per purchase | How much spend per purchase counted within this scope? | The cost of a unique new customer when repeat purchases are included. |
| Contribution after ads | What remains after variable costs and media spend? | Net profit, which also requires the other relevant expenses. |
| ROI for an operation | What net gain relative to the costs included in that operation? | A simple revenue/ad spend ratio; define all costs in the scope. |
Platform ROAS
- Question it answers
- What value does this report attribute to this spend?
- Not the same as
- Profit, all store net orders or a demonstrated causal effect.
Cost per purchase
- Question it answers
- How much spend per purchase counted within this scope?
- Not the same as
- The cost of a unique new customer when repeat purchases are included.
Contribution after ads
- Question it answers
- What remains after variable costs and media spend?
- Not the same as
- Net profit, which also requires the other relevant expenses.
ROI for an operation
- Question it answers
- What net gain relative to the costs included in that operation?
- Not the same as
- A simple revenue/ad spend ratio; define all costs in the scope.
- Record currency, tax basis, time zone and dates for each report.
- Check the purchase event, transmitted values and test orders.
- Separate purchases, retained orders and new customers.
- Review cancellations and returns while keeping the initial calculation.
PiPiAds offers leads, not a competitor's actual ROAS
Research helps frame a question: which demonstration explains the bundle? Which objection recurs in the copy? What does the opening scene show? Use PiPiAds or Adsparo to compare a few ads close to your offer and their destinations. Keep the presentation idea, not another seller's commercial claim.
Run time or estimated orders do not reveal supplier costs, refunds or advertiser contribution. In the PiPiAds illustration, ad cost and estimated orders appear as ranges. Those are not the reconciled expenses of a store you have audited. They cannot establish reliable profit.
For the storage bag set, useful research would cover sizes, piece count, valve compatibility and the packing demonstration. If an ad clarifies those points, shoot your own scene with the actual product. Keep the offer constant when comparing creatives so that a video change and a discount are not mixed together.

Separate observations from estimates
The demonstration shows an ad and several metrics, including estimated ranges. It illustrates ad research; neither the product claims nor the estimates are validated here as campaign results. Use your own account and orders for the economic calculation.
A creative score is not an accounting result
Atria presents creative analyses and recommendations from advertising signals. These can help name a hypothesis: show the product more clearly, explain its use or simplify the message. A score, confidence estimate or potential assessment cannot replace sales, spend and costs within your chosen scope.
The official site also describes connections to advertisers' own accounts. Those direct features are not automatically part of Spybox access. Keep orders, customer information and sensitive connections in your authorised professional environment. Public observations can inform creative choices without placing customer data in shared access.
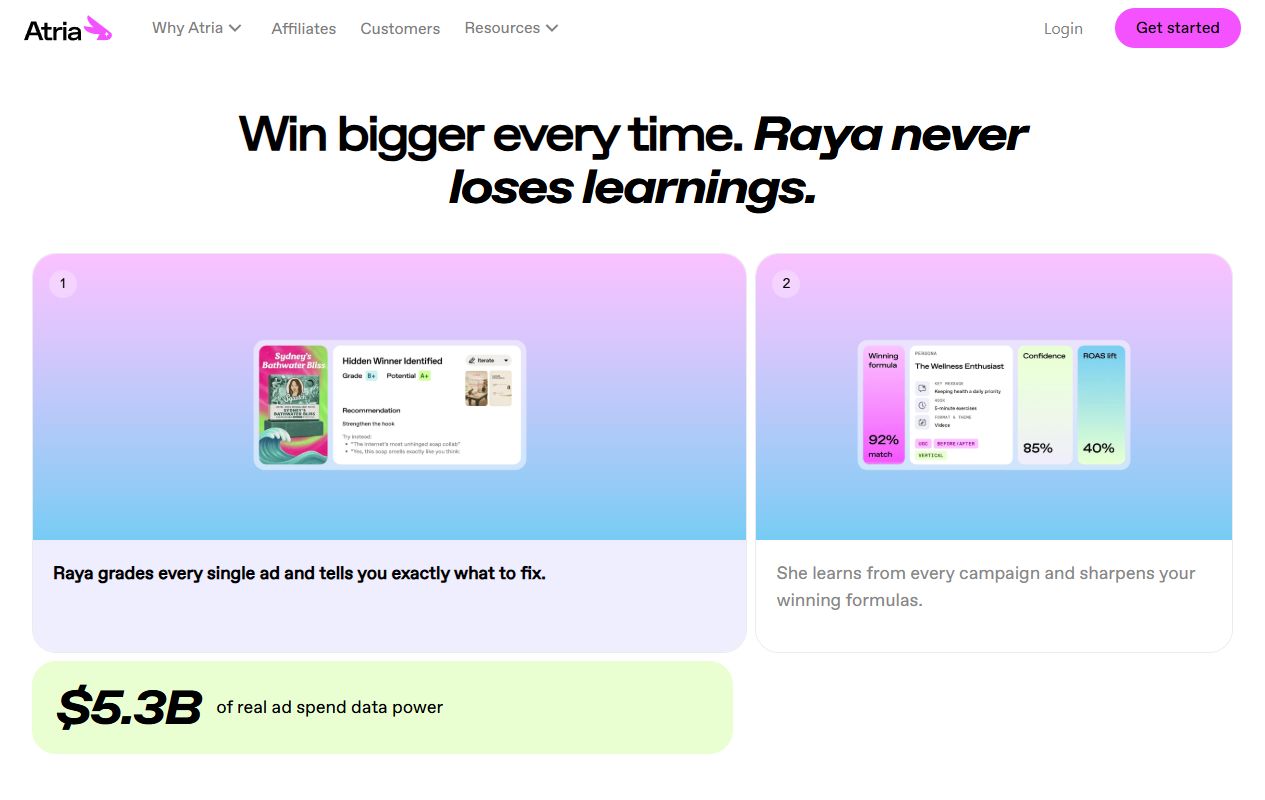
Atria: compare a recommendation with your results
The provider's visual associates a recommendation with scores. ROAS fit is different from ROAS calculated from orders and spend. Visible marketing assertions belong to Atria; they are neither our test nor a Spybox return promise.
Improve the message without hiding production cost
A creative attracting more clicks is not necessarily more useful. For the bags, show the number of pieces received and a real measurement rather than an impressive packing result customers cannot reproduce. Then follow orders, support requests and returns. A clearer ad may be preferable to one that sells more through an inaccurate expectation.
GetHookd can prepare variants; ChatGPT can help explain your product from your information; Canva adapts formats and Submagic helps finish video. Preparation time, filming, rights, subscriptions and consumed credits remain costs. Reducing them may improve the overall result, but does not mechanically increase media ROAS if revenue and advertising spend stay unchanged.
Choose one question to compare and retain the files actually served. For example, one opening immediately shows bag sizes while the other shows wardrobe use. Keep revenue, destination and measurement comparable. The ad optimisation guide covers checks and review for the whole test; here, the economic threshold helps interpret that review.
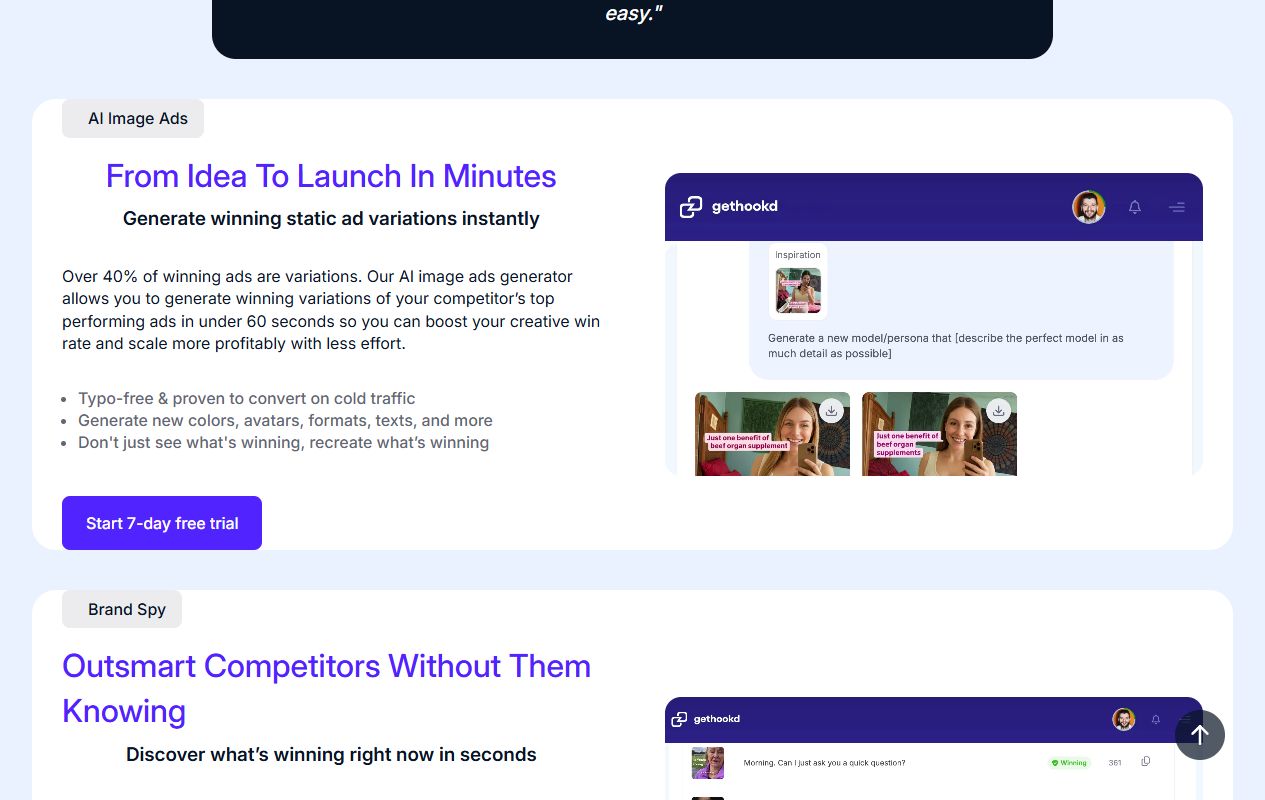
GetHookd: choose a useful difference
Visual suggestions are a starting point for comparison. Select one addressing a real objection and representing the product faithfully. The visual includes provider promises; it does not establish that a variant will reduce your acquisition cost.

Canva: keep the offer readable in each placement
Cropping may hide piece count, dimensions or an offer condition. Check the exported version on a phone with the areas occupied by the app. This image demonstrates formatting, not a measured sales improvement.
An economic threshold is not enough to raise the budget
Offer A averages €2 per order after ads, before other costs. Increasing spend does not guarantee the next orders keep that acquisition cost. Additional audiences may respond differently and costs or basket value may change. Examine additional revenue and spend rather than assuming the past average applies to the entire budget.
Separate your economic requirement from a bidding target. Google Ads uses Target ROAS to seek an average conversion value/cost ratio; its documentation notes that an excessive target can restrict traffic. Entering 400% does not ensure a ROAS of 4. Tracked values and available data also matter: do not blindly copy the calculator threshold into a platform.
Satisfactory ROAS can coexist with a cash shortage: advertising is charged, a supplier requests payment, and revenue becomes available later. Check inventory, fulfilment capacity, returns and overheads too. A campaign covering its media spend has not yet established that the business can fund higher volume.
- Recent conversions have had time to arrive and tracking incidents are identified.
- Retained orders and costs belong to the same scope.
- Expected contribution covers additional expenses and the chosen reserve.
- The store and supplier can fulfil the volume without degrading the offer.
- Budget and cash allow results to be monitored without relying on guaranteed profitability.
How Spybox supports work on ROAS
Spybox brings together 90+ research and creation tools. Published pricing is €29.99 per month or €249.99 per year, with 100,000 SBC credits per month, according to pricing information verified on August 4, 2026. The site code remains GET25; check conditions and the final amount before payment.
Its economic value depends on the tasks you actually use: research, script preparation, creative variants or format adaptation. The subscription does not include ad spend, product costs or shipping. SBC does not pay for media in your account. Compare available functions rather than assuming shared access is identical to an entire direct subscription.
| Task | Tool or source | Useful material for the decision |
|---|---|---|
| Calculate ROAS for your ads | Your own platform and store | Spend, attributed values and reconciled orders, not competitor estimates. |
| Understand a competitor's presentation | PiPiAds, Adsparo | A few public examples, the offer and points to explain differently. |
| Choose a creative hypothesis | Atria | One specific change, without treating a score as an economic result. |
| Prepare copy and variants | ChatGPT, GetHookd | A faithful product script and identifiable versions to compare. |
| Adapt visual formats | Canva, Submagic | Readable files in the selected formats, with production costs recorded. |
Calculate ROAS for your ads
- Tool or source
- Your own platform and store
- Useful material for the decision
- Spend, attributed values and reconciled orders, not competitor estimates.
Understand a competitor's presentation
- Tool or source
- PiPiAds, Adsparo
- Useful material for the decision
- A few public examples, the offer and points to explain differently.
Choose a creative hypothesis
- Tool or source
- Atria
- Useful material for the decision
- One specific change, without treating a score as an economic result.
Prepare copy and variants
- Tool or source
- ChatGPT, GetHookd
- Useful material for the decision
- A faithful product script and identifiable versions to compare.
Adapt visual formats
- Tool or source
- Canva, Submagic
- Useful material for the decision
- Readable files in the selected formats, with production costs recorded.
Questions about ROAS and Spybox
What is a good ecommerce ROAS?
One that leaves sufficient contribution for your business, considering costs and the measurement scope. There is no universal figure. With a 40% contribution before ads, the simplified threshold is 2.5; other expenses and the amount you want to retain can require more.
Does ROAS of 3 mean 300% profit?
No. It represents €3 of attributed value per €1 of media spend, or a 300% ratio. Products, shipping, payment, returns and other expenses still need covering. It is not a profit rate.
How do I calculate break-even ROAS?
On a consistent basis, divide net revenue per order by contribution before ads: revenue minus variable costs. With €50 revenue and €30 costs, that is 50 ÷ 20 = 2.5. This simplified calculation excludes overheads and production not included in the costs.
Does a discount always improve ROAS?
No, and even higher ROAS can leave less money. In the fictional exercise, B reaches about 2.84 against A's 2.78, but loses €100 before other expenses while A retains €200. The discount reduces contribution per order without lowering variable cost.
Can PiPiAds reveal a competitor's actual ROAS?
Not from public signals and estimates alone. Reconciled spend, net revenue and costs are among the missing information. PiPiAds can inform creative research; your campaign calculation comes from your own account and store.
Does the calculator save my amounts?
No. Calculation happens in the page without transmitting amounts or connecting a platform. It is simplified: costs absent from your entries are not covered automatically. Reloading restores the fictional example.
Do creative savings increase account ROAS?
Not mechanically when account ROAS includes only media spend and spend and revenue are unchanged. Reducing content costs can improve the overall result. Keep those expenses in your review, even with AI tools or shared subscriptions.
Does Google Ads Target ROAS guarantee the requested result?
No. It is a setting used to seek an average value/cost ratio. An excessive target may also restrict delivery. A calculated economic threshold does not replace the data, requirements and monitoring specific to the campaign.
Do SBC credits fund my campaigns?
No. They apply to available Spybox uses under tool conditions. Meta, TikTok or Google media spend remains your expense, as do products, logistics and production costs not included in access.
Sources and illustrations
Pages consulted October 3, 2026. Reused captures may predate the visit and show providers' public presentations. The calculations and two storage bag offers are fictional exercises, not customer results.